Introduction
The Tompkins County Rural Black Residence Project (TCRBR for short) identifies demographic & genealogical information on black residents in the county between 1820 & 1870, maps it, and makes it publicly accessible via a website. Several questions guided my research and the project’s form: How does one locate historically marginalized people on the landscape? What documents exist telling us about 19th-century black residents in Tompkins County? Do the structures people lived in still exist? Are there descendants alive today to whom this project will benefit? What would an interactive mapping project look like, and what should it include? How can researchers and students use this project’s maps?
Some of these questions are easier to answer than others, for example, regarding the project’s final form? Researchers studying a family can learn more easily where the family lived, if they ever moved, and who was present in their home(s) over the decades by searching a map and website, dramatically reducing their research time. On the other hand, educators could have students learn about local 19th-century black histories such as the development of neighborhoods, occupations, birthplaces, and other demographic trends. Teachers could take this one step further by introducing students to primary sources on the people they are learning about, preparing them for higher-level research as they age.
The other questions, however, are not as easy to answer. To locate 19th-century people on the landscape requires one to familiarize themselves with the following:
- Historical documents containing genealogical data (e.g., census records, wills, indentures, photographs, newspaper articles, maps, city directories, etc.).
- Oral histories told by either descendants or held in the minds or in the notes of historians.
- The material record left behind by those we research [however, this point often requires greater familiarity with the first two points].
When working with historical documents, one must be aware of the potential bias(es) and/or terminology differences between the 19th-century & today. Some historical census records include the value of a family’s home. One might expect this to reflect the size, condition, or the house’s location [which they often do], but this is not always the case if the home’s value is considered significantly different than others nearby. To identify this bias, one should compare this type of data on the family in question to that of their neighbors or track the value of the family’s property across several census years. Such comparisons should allow you to piece out objective data from biased data. Dissecting documents is key to rebuilding lost and/or forgotten stories.
Oral histories can provide details on people, places, practices, and even materials otherwise left out of the written record. It is important to note two things: First, oral histories are histories [I’ve used ‘histories’ here because people recount the past differently, and it’s necessary to acknowledge these differences]. Like documents, oral histories should not immediately be taken as fact; instead, they should be in conversation with historic documents, allowing the reconstruction of either a single or several stories. Secondly, and more importantly, this practice enriches and makes the stories we tell more personal.
Designing the Method
Several 19th-century maps were sourced to identify where families lived within each of Tompkins County’s municipalities. The most significant historical maps for this project were:
- The 1829 Burr map of Tompkins County.
- The 1853 Tompkins County map by Smith & Fagan which listed many residencies by name.
- The 1866 Topographical Atlas of Tompkins County by Stone & Stewart [sourced from William Hecht].
- The 1893 City of Ithaca map by Crandall [provided by Eve Snyder, of the History Center in Tompkins County].
These maps also proved helpful in identifying how the various municipalities changed over time (e.g., the loss of Hector to Schuyler County in 1854). Ancestry.com was the primary online repository used to source the federal census data on the county between 1820 & 1870. A series of census lists were created that included all of the county’s black residents and any white families they might have been living with. These census lists are available on the website’s Census page.
Demographic Maps: Method 1
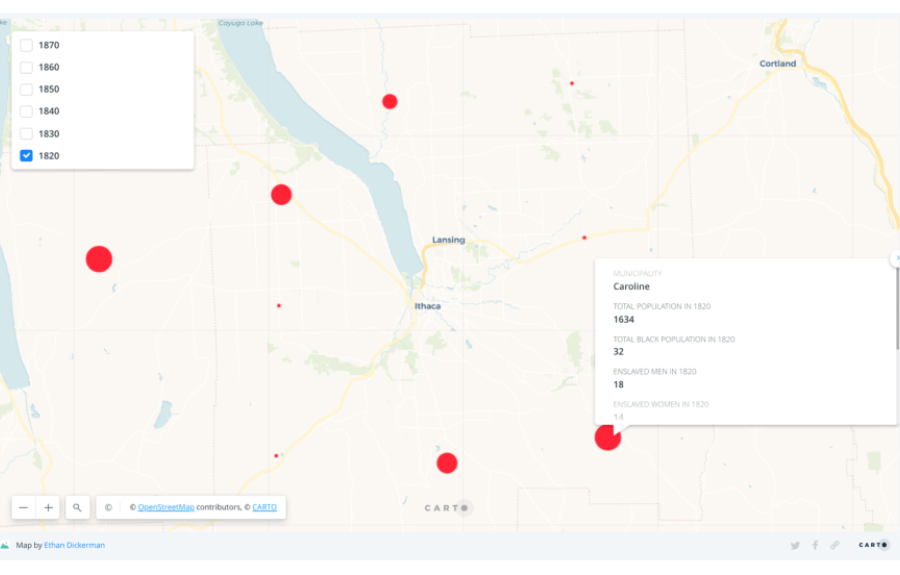
Few pre-1853 maps of Tompkins County identify where families lived, making it challenging to map where people lived during the 1820 through 1840 federal censuses. For this reason, I’ve postponed mapping residences for this period until a later phase in the TCRBR Project. Nevertheless, the demographic data from 1820 through 1840 was still meaningful and needed to be shared. To do this, Carto, an online mapping program, was used to display each municipality’s demographics. These Carto maps contain geotagged disks [in the heart of each municipality, scaled according to the municipality’s black population during the 1820, 1830, and 1840 federal censuses [the 1850 – 1870 federal census records were also included in this map].
(Figure 1: Method 1: Image of the TCRBR Project’s 1820-1870 demographic map. Sourced from the TCRBR Project’s website.)

